Private Equity Reimagined
Where higher returns are accompanied by lower risk, as in the case of private equity, that asset class becomes compelling.

Print PDF Version
A brief overview
Historically, private equity investments have primarily only been accessible to large and sophisticated institutions, endowment funds, family offices, and a limited number of ultra-high net worth investors. Due to the inherent characteristics of private equity, this select group accepted inflexible investment terms, limited access to the invested capital, and a general lack of transparency, in return for exposure to an asset class that (the data clearly shows) has consistently outperformed listed shares – before and after allowing for risk – whilst also providing additional diversification benefits.
Private Equity allocations have ramped up even further over recent years, with this trend expected to remain an ongoing theme, supported by influences such as near-zero interest rates, elevated valuations in traditional markets and the opportunities presented by emerging markets, innovation and disruption. At the same time, long term return expectations continue to favour private equity relative to listed equities, particularly for the subset of private equity fund managers who have demonstrated a consistent ability to achieve top quartile returns.
A recent structural innovation now allows retail investors the ability to access these global private equity investments via securities traded on major stock exchanges, Listed Private Equity (currently made available exclusively through ASX: PE1 – Australia’s only listed portfolio of global private equity investments), addresses certain aspects of global private equity that have previously deterred, or even excluded, some investors.
Traditional Private Equity
PE investing is typically characterised by a number of factors which, to date, have limited retail investors from being able to access this exciting asset class. These include:
- large minimum investment amounts make it difficult to gain access, and harder still to achieve diversification. Excess demand for top performing private equity managers means these funds are also generally oversubscribed,
- long-term illiquidity, whereby PE investments often require a substantial minimum commitment that may be ‘locked up’ or inaccessible for 10 years or more,
- inflexible timing, as PE funds are often closed to investors and may remain uninvested for some time as they await underlying investment opportunities,
- lack of transparency, with PE investors having limited information on target companies and receiving infrequent valuations,
- the absence of clear price discovery, meaning that transaction pricing in private markets depends substantially on negotiations, and
- reduced separation between ownership and control which elevates the role of manager resources and expertise.
However, two further characteristics are observed.
- The outperformance of private equity compared to public equity. Conceptually, this follows from PE investors requiring compensation for accepting the complexities and illiquidity of PE.
- The ability for skilled private equity managers to clearly and consistently distinguish themselves through superior performance.
Private Equity’s superior performance makes it a compelling investment
Looking at returns, the outperformance of private equity versus global listed shares is widely acknowledged (see chart 2 below). Less well-known is the portfolio diversification benefit associated with including PE in a traditional portfolio of bonds and equities. If a 20% allocation to private equity was made to a traditional portfolio of 60% equities and 40% bonds, thereby creating exposure of 50%/30%/20% (equities, bonds, PE), the new portfolio historically generated increased returns with reduced volatility. This is an important result as higher investment returns are usually accompanied by higher risk.
Where higher returns are accompanied by lower risk, as in the case of private equity, that asset class becomes compelling.
CHAR T 1: SUPERIOR RISK-ADJUSTED RETURNS (1)
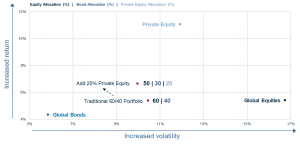
Chart 1 illustrates the higher returns and lower risk of private equity compared to global equities. Moreover, by displaying the ratio of return to risk, the chart shows the superiority of risk-adjusted PE returns relative to both shares and bonds.
A more consistent return comparison
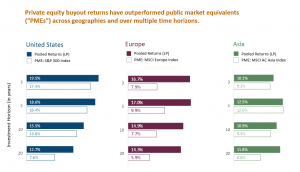
Comparing the performance of PE to share market index returns could be misleading, due to the uncertain and variable timing of cash flows that is characteristic of private equity investments. To create a more valid comparison, one technique is the calculation of a ‘Public Market Equivalent ‘(PME) equity return series that replicates private equity cashflows in a share market index.
Using this approach, Chart 2 shows a performance comparison between PE buyout returns and local market equities. Over time horizons from 3 years to 5, 10, and 20 years, PE returns are again superior – in most cases, by a large margin.
CHART 2: SUPERIOR LONG-TERM RETURNS (2)
To conclude, we summarise the key conclusions in relation to historical private equity performance:
- private equity has consistently outperformed shares while exhibiting lower risk, thereby providing superior risk-adjusted returns, and
- private equity provides portfolio diversification benefits, being less than perfectly correlated to equities.
Enter Listed Private Equity – A gamechanger for Australian investors
In response to the superior returns offered by PE, while at the same time addressing aspects of the asset class that have previously deterred investors, Listed Private Equity enables private equity investment via publicly traded securities listed on major stock exchanges. Accordingly, within this listed framework, LPE overcomes several of the challenges of ‘traditional’ PE, as outlined below.
- As an exchange traded product, traditionally high minimum investment amounts are no longer applicable reducing this barrier to entry.
- The listed structure allows ready access to a ‘permanent’ portfolio of underlying PE assets (since the proceeds from investments can be recycled into new transactions) without liquidity, size or timing constraints.
- The flexibility of LPE means that exposures can be adjusted dynamically in response to investor preferences, market conditions and the investment exposures of the underlying portfolio.
- LPE can provide diversification of PE exposures across a range of maturities, styles, sectors and geographies with less ‘cash drag’ than traditional PE (whereby performance is typically curbed by capital remaining uninvested early – and often for years – in the investment term of an unlisted fund).
- Transparency is significantly enhanced with LPE, not only by the availability of daily market prices but also due to the strict disclosure, reporting and governance requirements associated with listing on a regulated exchange.
- LPE securities are generally able to provide more predictable cash flows as listed trusts typically pay regular distributions (3).
Given these advantages, the research reveals a “strong positive relationship between the allocation to private investments and portfolio return” (4), and consideration of LPE’s place in an investment portfolio is certainly warranted.
PE1 (Australia’s only global LPE vehicle) currently holds investments in over 550 underlying private companies, including 6 of the world’s top 10 most valuable private unicorns. Companies like Instacart, Stripe, Rivian, Spacex, Transferwise, Uber freight, Byte Dance, and Cotiviti make up some of PE1’s largest positions.
More information on PE1 can be accessed HERE
An excerpt from a whitepaper produced by Steven Milch, consulting economist, Pengana Capital Group.
(1) Annualised return (%) (the vertical axis) versus annualised standard deviation (%) (the horizontal axis), 20 years ending 30 September 2019. “Annualised Standard Deviation” is a measure of how much the price of an asset or the return of a portfolio of assets has fluctuated (both up and down) over a certain period. If a portfolio of assets has a high Annualised Standard Deviation, the return of the portfolio of assets has historically fluctuated vigorously. If a portfolio of assets has a low Annualised Standard Deviation, the return of the portfolio of assets has historically moved at a steady pace over a period of time.
Portfolio calculation assumes quarterly rebalancing of stock and bond allocations. Index returns assume reinvestment of coupons. “Global Equity Allocation” represented by MSCI World Index, “Global Bond Allocation” represented by Bloomberg Barclays Global Aggregate Bond Index, “Private Equity Allocation” represented by Burgiss private equity pooled time-weighted returns.
Source: The above graph was prepared by GCM utilising certain information obtained from Burgiss. The graph is based on published 3Q 2019 benchmark data.
Burgiss sources their data from MSCI, Bloomberg Barclays and private equity funds worldwide (the “Burgiss Manager Universe”). The Burgiss Manager Universe includes data from 8,772 global private funds. GCM uploads data into its system used to prepare the above graph one-time each quarter; however, the data service may continue to update its information thereafter. Therefore, information in GCM’s system may not always agree with the most current information available from the data service. Additional information is available upon request. MSCI makes no express or implied warranties or representations and shall have no liability whatsoever with respect to any MSCI data contained herein. The MSCI data may not be further redistributed or used to create indices or financial products. This graph is not approved or produced by MSCI. Burgiss, MSCI, and Bloomberg Barclays have not provided consent to the inclusion of statements utilising their data. Past performance is not necessarily a guide to future performance. No assurance can be given that any investment will achieve its objective or avoid losses.
(2) Sources: MSCI, S&P and BURGISS (BURGISS data as of March 31, 2021, downloaded July 21, 2021). United States returns are stated in USD. Europe returns include investments with a focus on the developed world and are stated in EUR. Asia returns include private equity expansion capital investments and are stated in USD. All “Public Market Equivalent” returns were calculated using the Long-Nickels methodology and were obtained from Burgiss. All data shown as net to Limited Partners, unless otherwise noted. Pooled Return (LP): The pooled IRR calculation uses pooled cash flows over the specific horizon period, meaning the data for the funds are aggregated and the return is calculated on the single stream of aggregate cash flows. No assurance can be given that any investment will achieve its objectives or avoid losses. Past performance is not necessarily indicative of any future results.